Examples
Presented here are four example CSVG documents demonstrating the powerful dynamic layout abilities which are obtained by adding evaluated expressions to SVG.
Example 1 — Dynamic layout
Consider a situation where you have a flow diagram which you want to be displayable both on a computer monitor with a landscape display and a PDA with a portrait display. This diagram has three boxes with arrows between them. When viewed on a display with sufficient width these boxes and arrows should be arranged horizontally, and when there isn't, vertically. The two images below show these two situations.
We can achieve this in CSVG by having the positioning of the rects dependent on the size of the viewport. The complete code is in box-arrow.svg.
The important part of this code is the c:variable elements which define the coordinates of the rects: b1x, b1y, b2x, b2y, b3x and b1y.
+ $desiredGap * 2 + $margin * 2"/>
c:width(c:viewport()) div 2 - $boxWidth div 2)"/>
c:height(c:viewport()) div 2 - $boxHeight div 2, $margin)"/>
c:width(c:viewport()) - $margin - $boxWidth,
c:width(c:viewport()) div 2 - $boxWidth div 2)"/>
c:height(c:viewport()) div 2 - $boxHeight div 2,
c:height(c:viewport()) - $margin - $boxHeight)"/>
These coordinates depend on the horizontal variable, which is defined in this example to be true when the horizontal layout is possible (there is enough horizontal viewport space) and false otherwise. This is determined by looking at the width of the viewport (c:width(c:viewport())) and comparing it to the minimum width required for the three boxes and two arrows. A conditional in the XPath expressions (c:if(.., .., ..)) is used to choose a particular value if the layout should be horizontal, and a different value otherwise.
If the user resizes the CSVG browser such that the width isn't great enough to show the diagram horizontally, the horizontal variable will become false. Since the box coordinate variables depend on horizontal, the constraint solver will then update these constraints to give the new positions of the rects.
Note that this example contains no script. All of the relayout is done by the constraint solver automatically, and only when needed.
Example 2 — Preventing zooming
This second example demonstrates two features: the use of constraints to to build, layout and prevent the zooming of UI widgets, and some simple interaction.
A common requirement for an SVG based application is to have a panel of user interface widgets at the side of a diagram which should not be affected by the current zoom and translation of the document. To go about this with script one would have an event handler for the onzoom and onscroll events of the svg element. This event handler would recalculate the positions and sizes of the widgets according to either the currentScale and currentTranslate properties, or the screenCTM of the graphics elements in question.
Here are two images of the document being displayed at a currentScale of 1 and a currentTranslate of 0,0 (i.e., no zooming and panning has been done by the user), and also once some zooming and panning has been done.
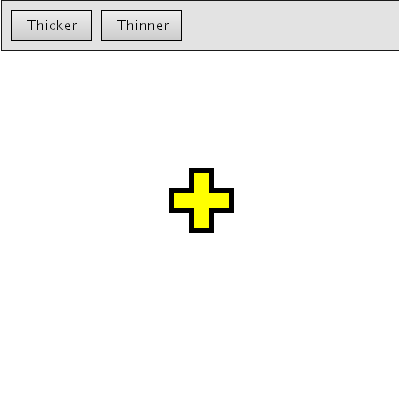
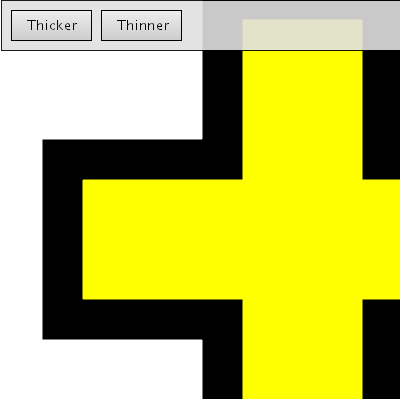
In a CSVG solution, no-zoom.svg, we can simply write expressions for the transform attribute of the widgets in terms of the c:screenCTM() function. Look at, for example, the code for the "Thicker" button:
Only a single constraint is required to keep the panel of widgets at the top of the canvas. The widgets are grouped into a g element whose transform attribute is set to c:inverse(c:screenCTM(..)). The screen CTM of the parent of the g element (in this case, the root svg element) is the transformation required to move from the g's coordinate space to the pixel coordinate space being used to render the document. The inverse of the matrix can be applied to the g so that the coordinate space remains the same, regardless of any explicit transformations on parent elements or caused by zooming and panning.
Thus to achieve the "no zoom" property of the widgets, again no script was needed. Because of the dependencies in the expressions, the constraint manager automatically updates the attributes which refer in some way to the screen CTM of an element.
This example also has a degree of interactivity. The buttons can be clicked to change the thickness of the stroke used on the yellow cross. To effect a button-like appearance, the rect's stroke-width and the text's x and y attributes for the "Thicker" button are written in terms of a variable btn1down. This variable is set to 1 when the mouse button has been pressed down on the button, and 0 otherwise. When this variable is set to 1, the stroke-width of the rect becomes larger and the label moves down and to the right by 1 unit, giving the button a "depressed" feel. The btn1down variable is changed by way of some short event handlers on the rect. The btnup and btndown functions are attached to onmousedown and onmouseup.
In the future a better mechanism for changing variable values from script will be provided so that it is easier for a simple one function call inside the event handler attributes to be used, rather than having to call a separate function.
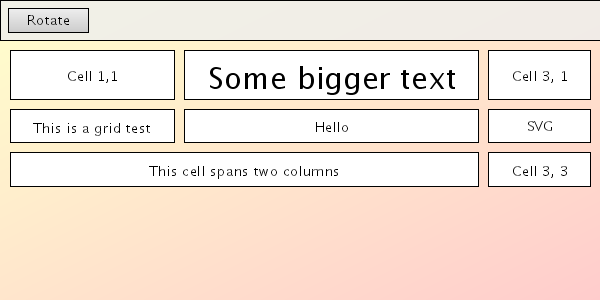
Example 3 — Grid layout
The introduction of an HTML-like table element into the recent prerelease of Adobe's SVG viewer have been in response to a need by developers to lay out elements of SVG documents in a grid. This obviates the need for long, complicated script to achieve the same goal.
For this example, assume there is a grid of 3 x 3 cells, where each cell is a rect with a text element placed over it. The cell widths and heights should change to both accommodate the being displayed in them, and also the current width of the viewport. This is similar to an HTML table with its width attribute set to "100%". If the browser window width is increased, each column of the table can become larger, to fill the whole width of the viewport. When the browser width is decreased, the opposite occurs. Each of the columns, though, maintains at least enough width to enclose the largest cell content in that column.
See the images here of this grid example. The first image is at a reasonable sizing, where each column has more than enough space to fit its cell contents. The second image is when the browser window has been reduced such that at least one of the cells would not fit its content were it smaller.
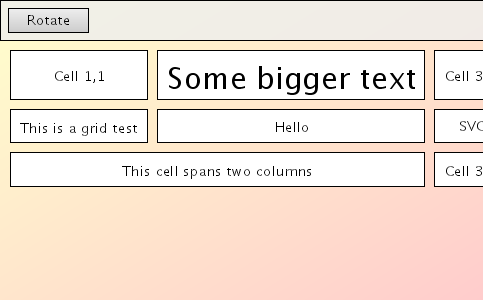
Because there is not enough space to display each of the columns at their minimum widths, the table falls off the edge of the viewport.
Constraints are used in this example, grid.svg, first to determine the minimum width of each of the columns. This is done using the c:max() function on the c:bbox() of each of the cell contents (the text elements).
The t11w, t12w and t13w variables simply hold the c:width(c:bbox()) of the corresponding text element. With this we have the minimum width of the grid as a whole. If this is less than the width of the viewport then there is some horizontal space to spare, and this should be shared out to the three columns.
- ($min1w + $min2w + $min3w)"/>
The rem variable holds the amount of horizontal space remaining (possible negative if the table will overflow the viewport). The share variable determines how much of this remainder should be allocated to each column. If the remainder is actually negative, then we do not wish to adjust the column widths any further. If it is positive, however, this remainder width divided by 3 should go to each column. The share variable is used then to calculate the final widths of each cell.
The rects which form the cells then have their width attributes expressed in terms of these variables.
Example 4 — Expanding and collapsing
Finally, we have an example which embodies both user interaction and dynamic layout. This example presents to the user an organisation chart, which is just a tree with labels on each node. By clicking on a node it will expand or collapse, allowing the user to navigate around the chart.
The following two images show the organisation chart when it is fully collapsed and fully expanded.

The dynamic layout for this example, expand-collapse.svg, is relatively simple. The root node's rect is placed at the top of the diagram and each subsequent rect is placed relative to the rect directly above it. Since, though, the rect directly above a given rect may change due to expanding and collapsing, the expressions which determine the y coordinate of the rect must take this into account.
Three variables are used to store the state of the three nodes which have children. They are set to true if the node is expanded, and false if collapsed. Initially each node is collapsed.
When a rect is clicked it calls a script function called toggle to change the value of the appropriate variable.
The y coordinate of the rects depend on these variables. See, for example, the rect used for the "Faculty of Information Technology" node.
The y attribute is an expression which checks the state of the o1 variable. This is the variable which represents the expanded/collapsed state of the "Faculty of Arts" node. If the variable is true, that is the Arts node is expanded, then the y attribute of the "IT" node should be just below the "School of Philosophy and Bioethics" node. If not, then it should be just below the "Faculty of Arts" node, as its children won't be displayed. Similar logic is used for the other nodes and for the lines which make up the tree stems in the diagram.
The rects also respond to the mouse cursor being hovered over them, increasing their stroke-width when this happens. This is achieved by calling a function which modifies a variable representing the current hover state for a node.
Simple functions modify these variables when the mouse enters or exits a rect, being attached to the onmouseover and onmouseout attribute as seen in the code snippet above.